Cacti
Cacti helps companies understand their greenhouse gas emissions, identify the areas of their business driving the most impact, and receive tailored recommendations to reduce their carbon footprint. The platform connects climate insights to practical action by helping users compare reduction strategies, understand buyer expectations, and unlock financing solutions that make sustainable change possible.
My Role
Design Lead
My Contribution
Product Strategy
Design Leadership
Stakeholder Presentation
Research
My Deliverables
Roadmap
UX Construct
Wireframes
Relationship Manager Experience
Research Reports
Team
3 designers
5 engineers
Cacti is a platform designed to help banks and their business clients move from climate awareness to measurable climate action. Many companies know that greenhouse gas emissions matter, but they often struggle to understand where their emissions come from, how climate risk affects their business relationships, and which actions are financially realistic.
The product supports two connected experiences: one for relationship managers who advise clients, and one for companies completing their own emissions profile. Together, the platform helps users understand why climate matters, calculate or estimate emissions, identify practical reduction opportunities, and connect those opportunities to financing options such as green loans, subsidies, and other sustainable finance products.
Climate action is difficult for companies because the path from “we need to reduce emissions” to “here is what we should do next” is often unclear.
Barriers to Entry
01
Understanding where to start
They may not understand greenhouse gas emissions well enough to identify where to start. Fuel combustion, purchased electricity, waste, and supply chain emissions can feel abstract and technical.
02
Lack of Data
They may not have a complete emissions baseline. Without structured data collection, companies cannot see which parts of their operations drive the most emissions or how they compare to industry averages.
03
Lack of Personalization
They may receive generic climate advice that is not tied to their business, industry, buyer pressure, or financing options.
04
Lack of tools linking climate action to finance
Bank relationship managers may want to advise clients on climate transition, but they need clearer tools to understand each client’s risk, opportunities, and readiness.
04
Lack of tools linking climate action to finance
Bank relationship managers may want to advise clients on climate transition, but they need clearer tools to understand each client’s risk, opportunities, and readiness.
The design challenge was to make a complex sustainability workflow feel approachable, actionable, and business-relevant. As Design Lead, I was responsible for shaping the product experience from high-level strategy through final UI execution.
My contributions included defining the information architecture, leading the design direction, building scalable patterns, shaping the recommendation and finance flows, and guiding the team through iteration. I also supported people development by helping designers strengthen their systems thinking, improve the clarity of their rationale, and connect design decisions back to user and business outcomes.
Product Strategy
The platform was designed around a simple progression of actions:
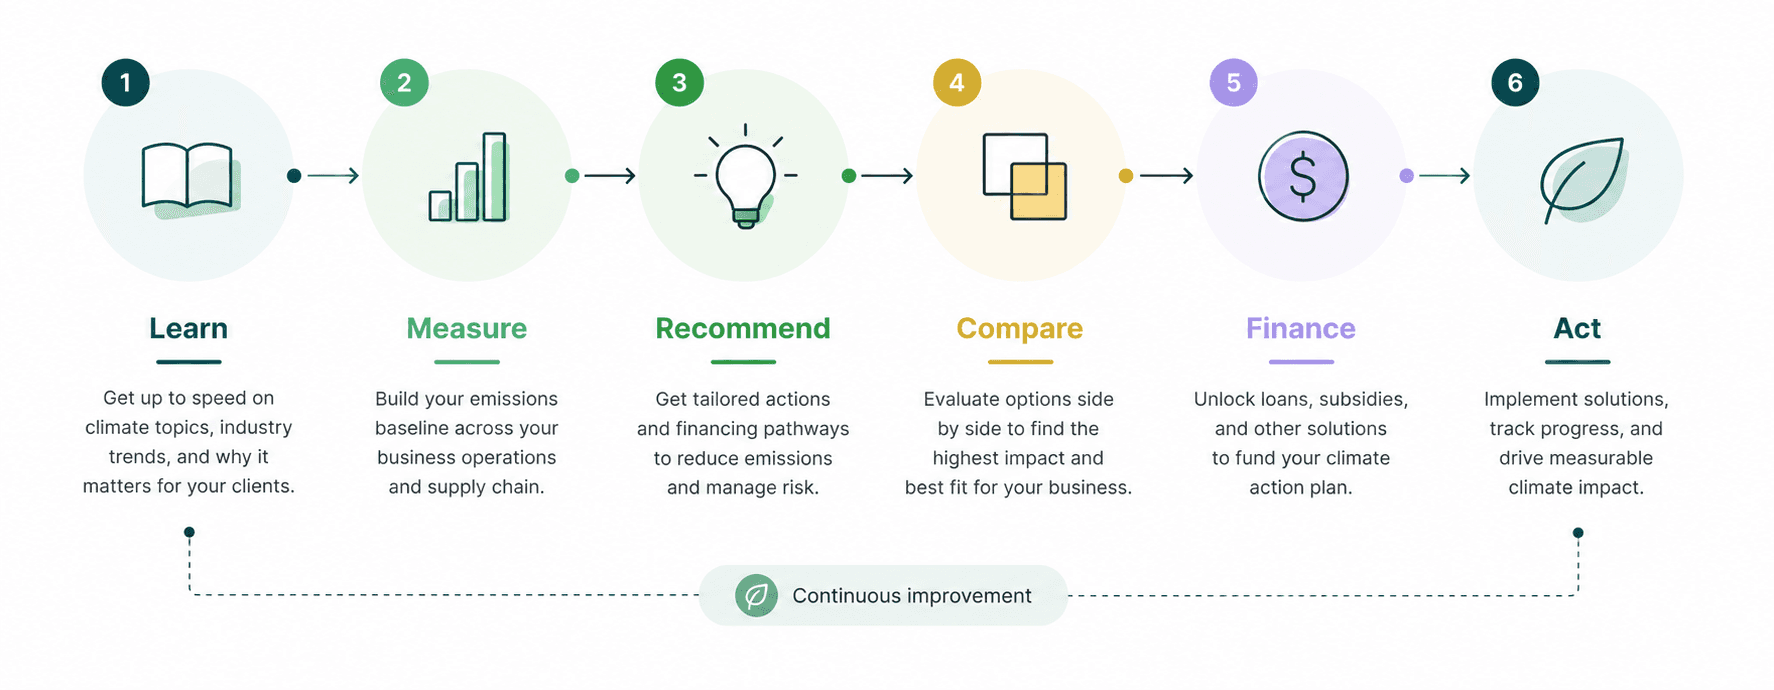
This structure helped us organize the product around user intent instead of internal data categories.
The Dashboard helps users stay informed and access high-priority content. It includes trending talking points, a knowledge center, a news stand, and quick access to client-related actions.
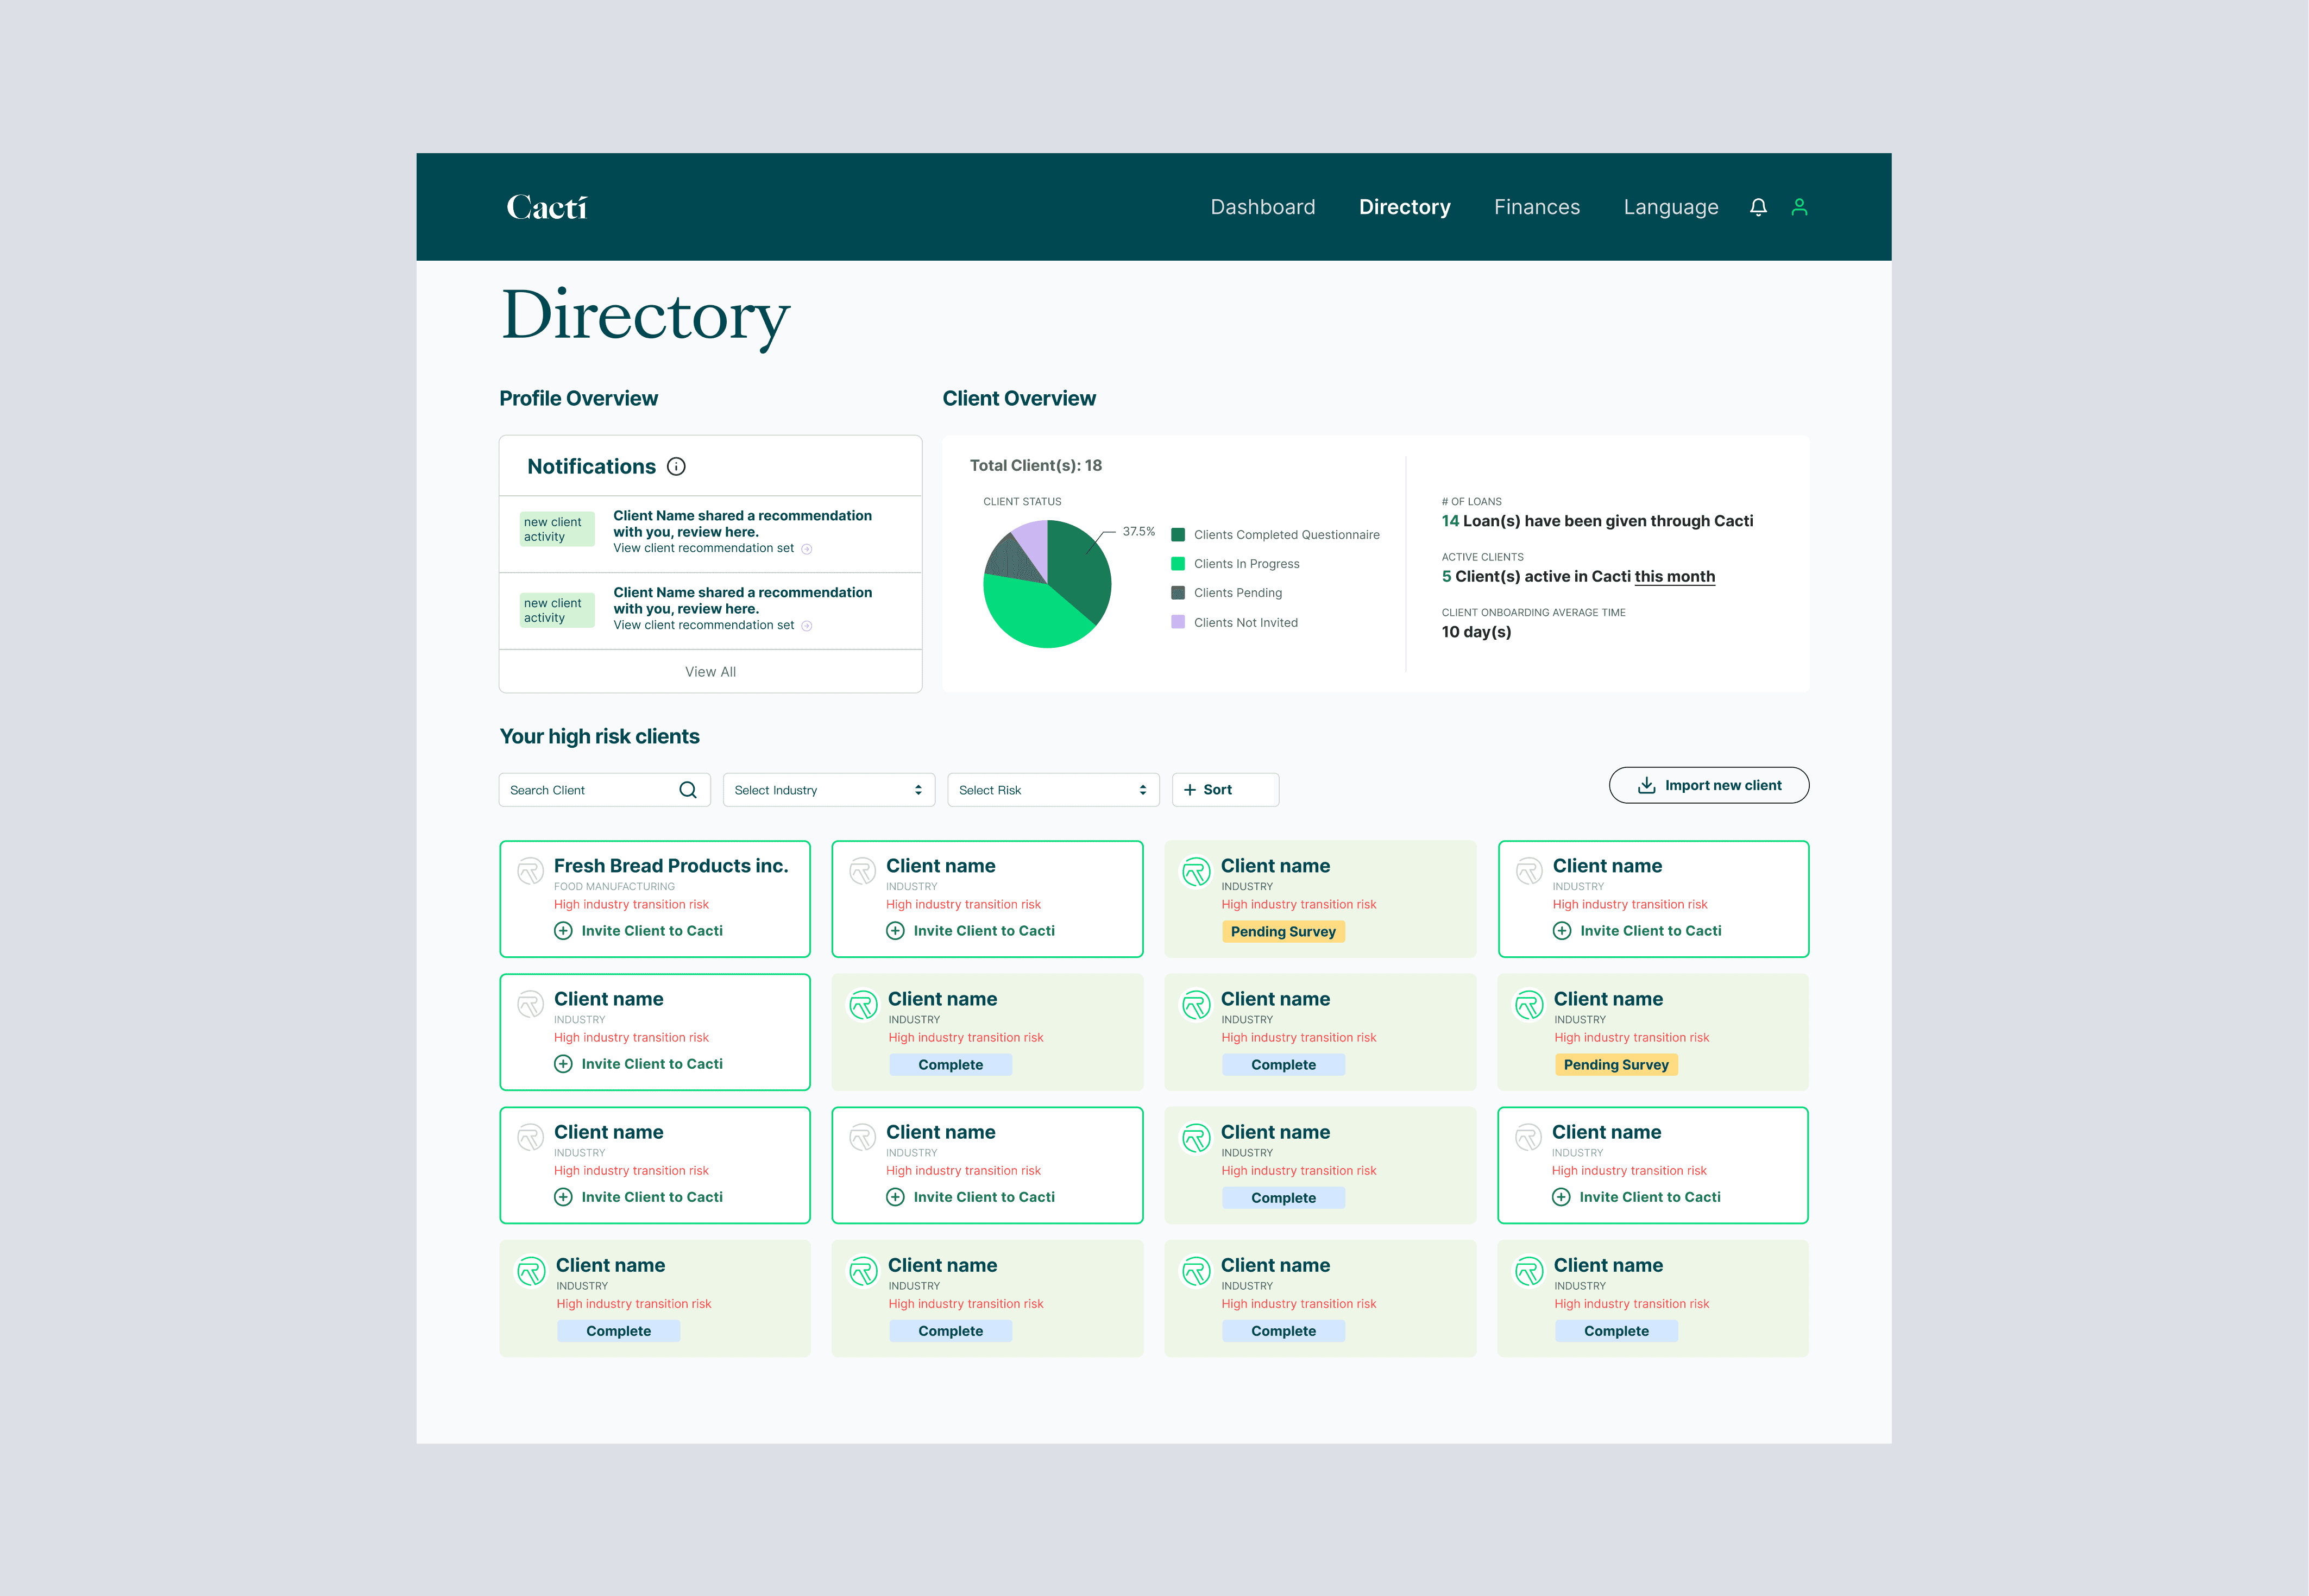
The Directory gives relationship managers a portfolio-level view of clients. It shows client status, industry breakdown, onboarding progress, risk level, and actions like inviting a client to Cacti.
The Client Profile gives a detailed view of a specific company’s emissions, recommendations, buyer commitments, financing options, and incentives.
The SME Dashboard gives business clients a personalized view of their emissions, activities, recommendations, buyer commitments, and resources.
The Business Profile / Onboarding Flow collects the information needed to estimate emissions across business profile, fuel consumption, energy consumption, supply chain emissions, and process emissions.
The Finances section helps users move from recommendations to funding options, including green loans, energy efficiency bonds, subsidies, and product-specific financing details
Information Architecture
To define the product structure, the team created separate information architecture diagrams for the two primary user types: Relationship Managers and SME clients. This helped clarify how each audience would move through the platform based on their goals, responsibilities, and level of climate knowledge.


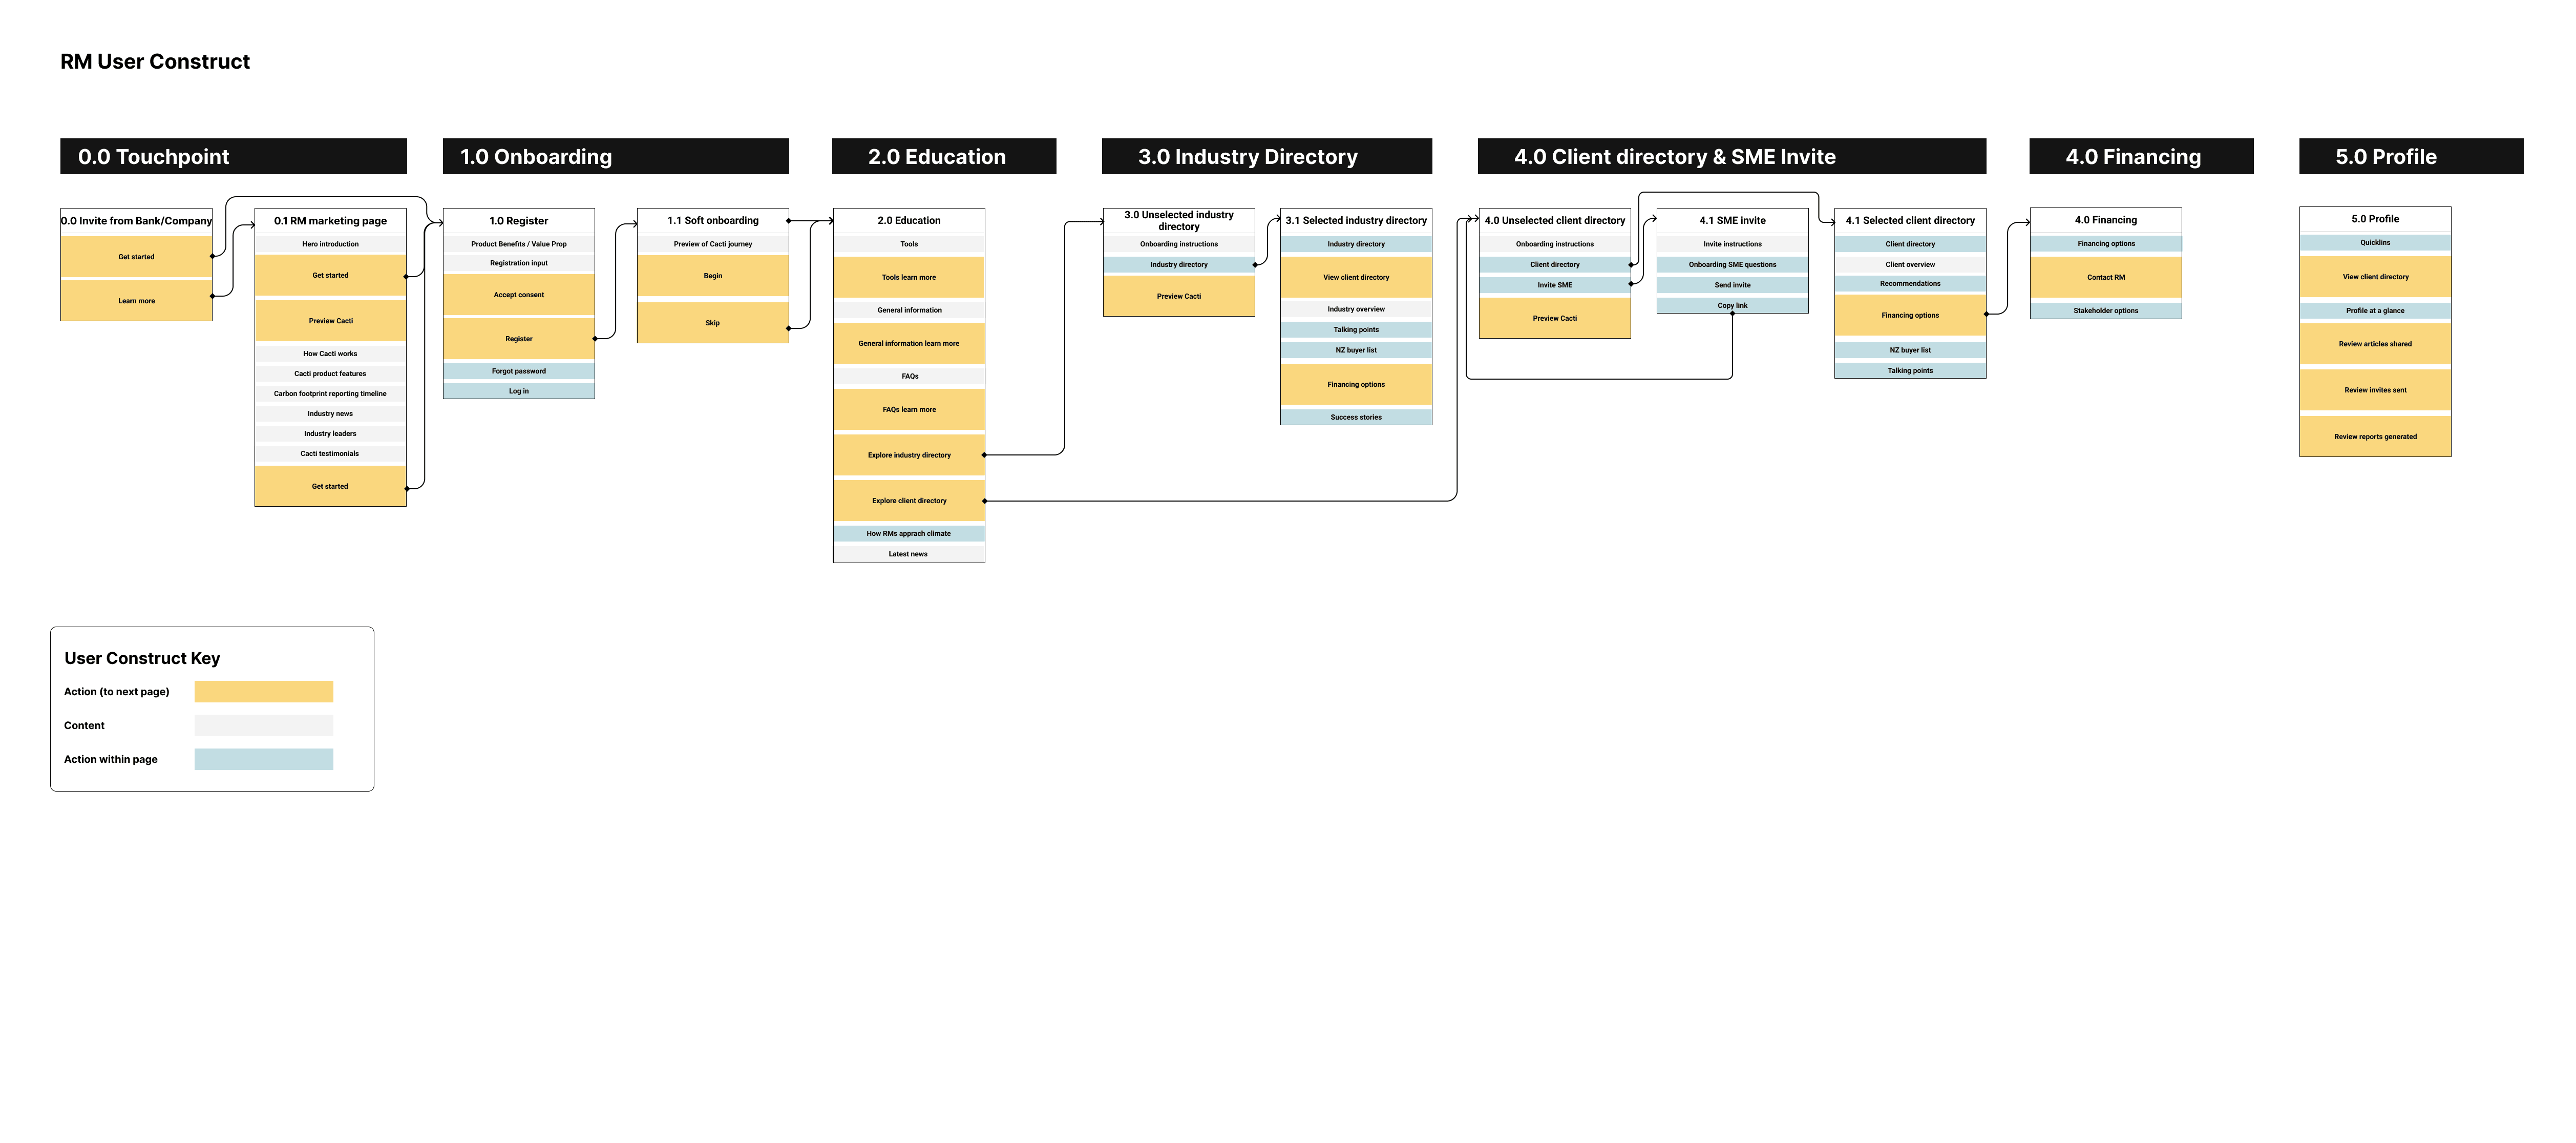
UX Constructs
To move from high-level information architecture into a more actionable product blueprint, I taught the team how to create UX constructs for both the Relationship Manager and SME experiences. These constructs mapped the end-to-end journey at a screen and interaction level, showing how each user type would move through onboarding, education, directory exploration, recommendations, financing, reporting, and profile management.
I used a color-coded system to distinguish content, actions within a page, and actions that moved users to the next screen. This made it easier to evaluate the flow, identify decision points, and ensure that each step had a clear purpose. The constructs also helped align stakeholders around the MVP experience, reveal dependencies between RM and SME workflows, and translate a complex climate-finance journey into a structured, user-centered product experience.This helped to remove ambiguity while designing and make presenting our design strategy decisions and changes to stakeholders much easier.

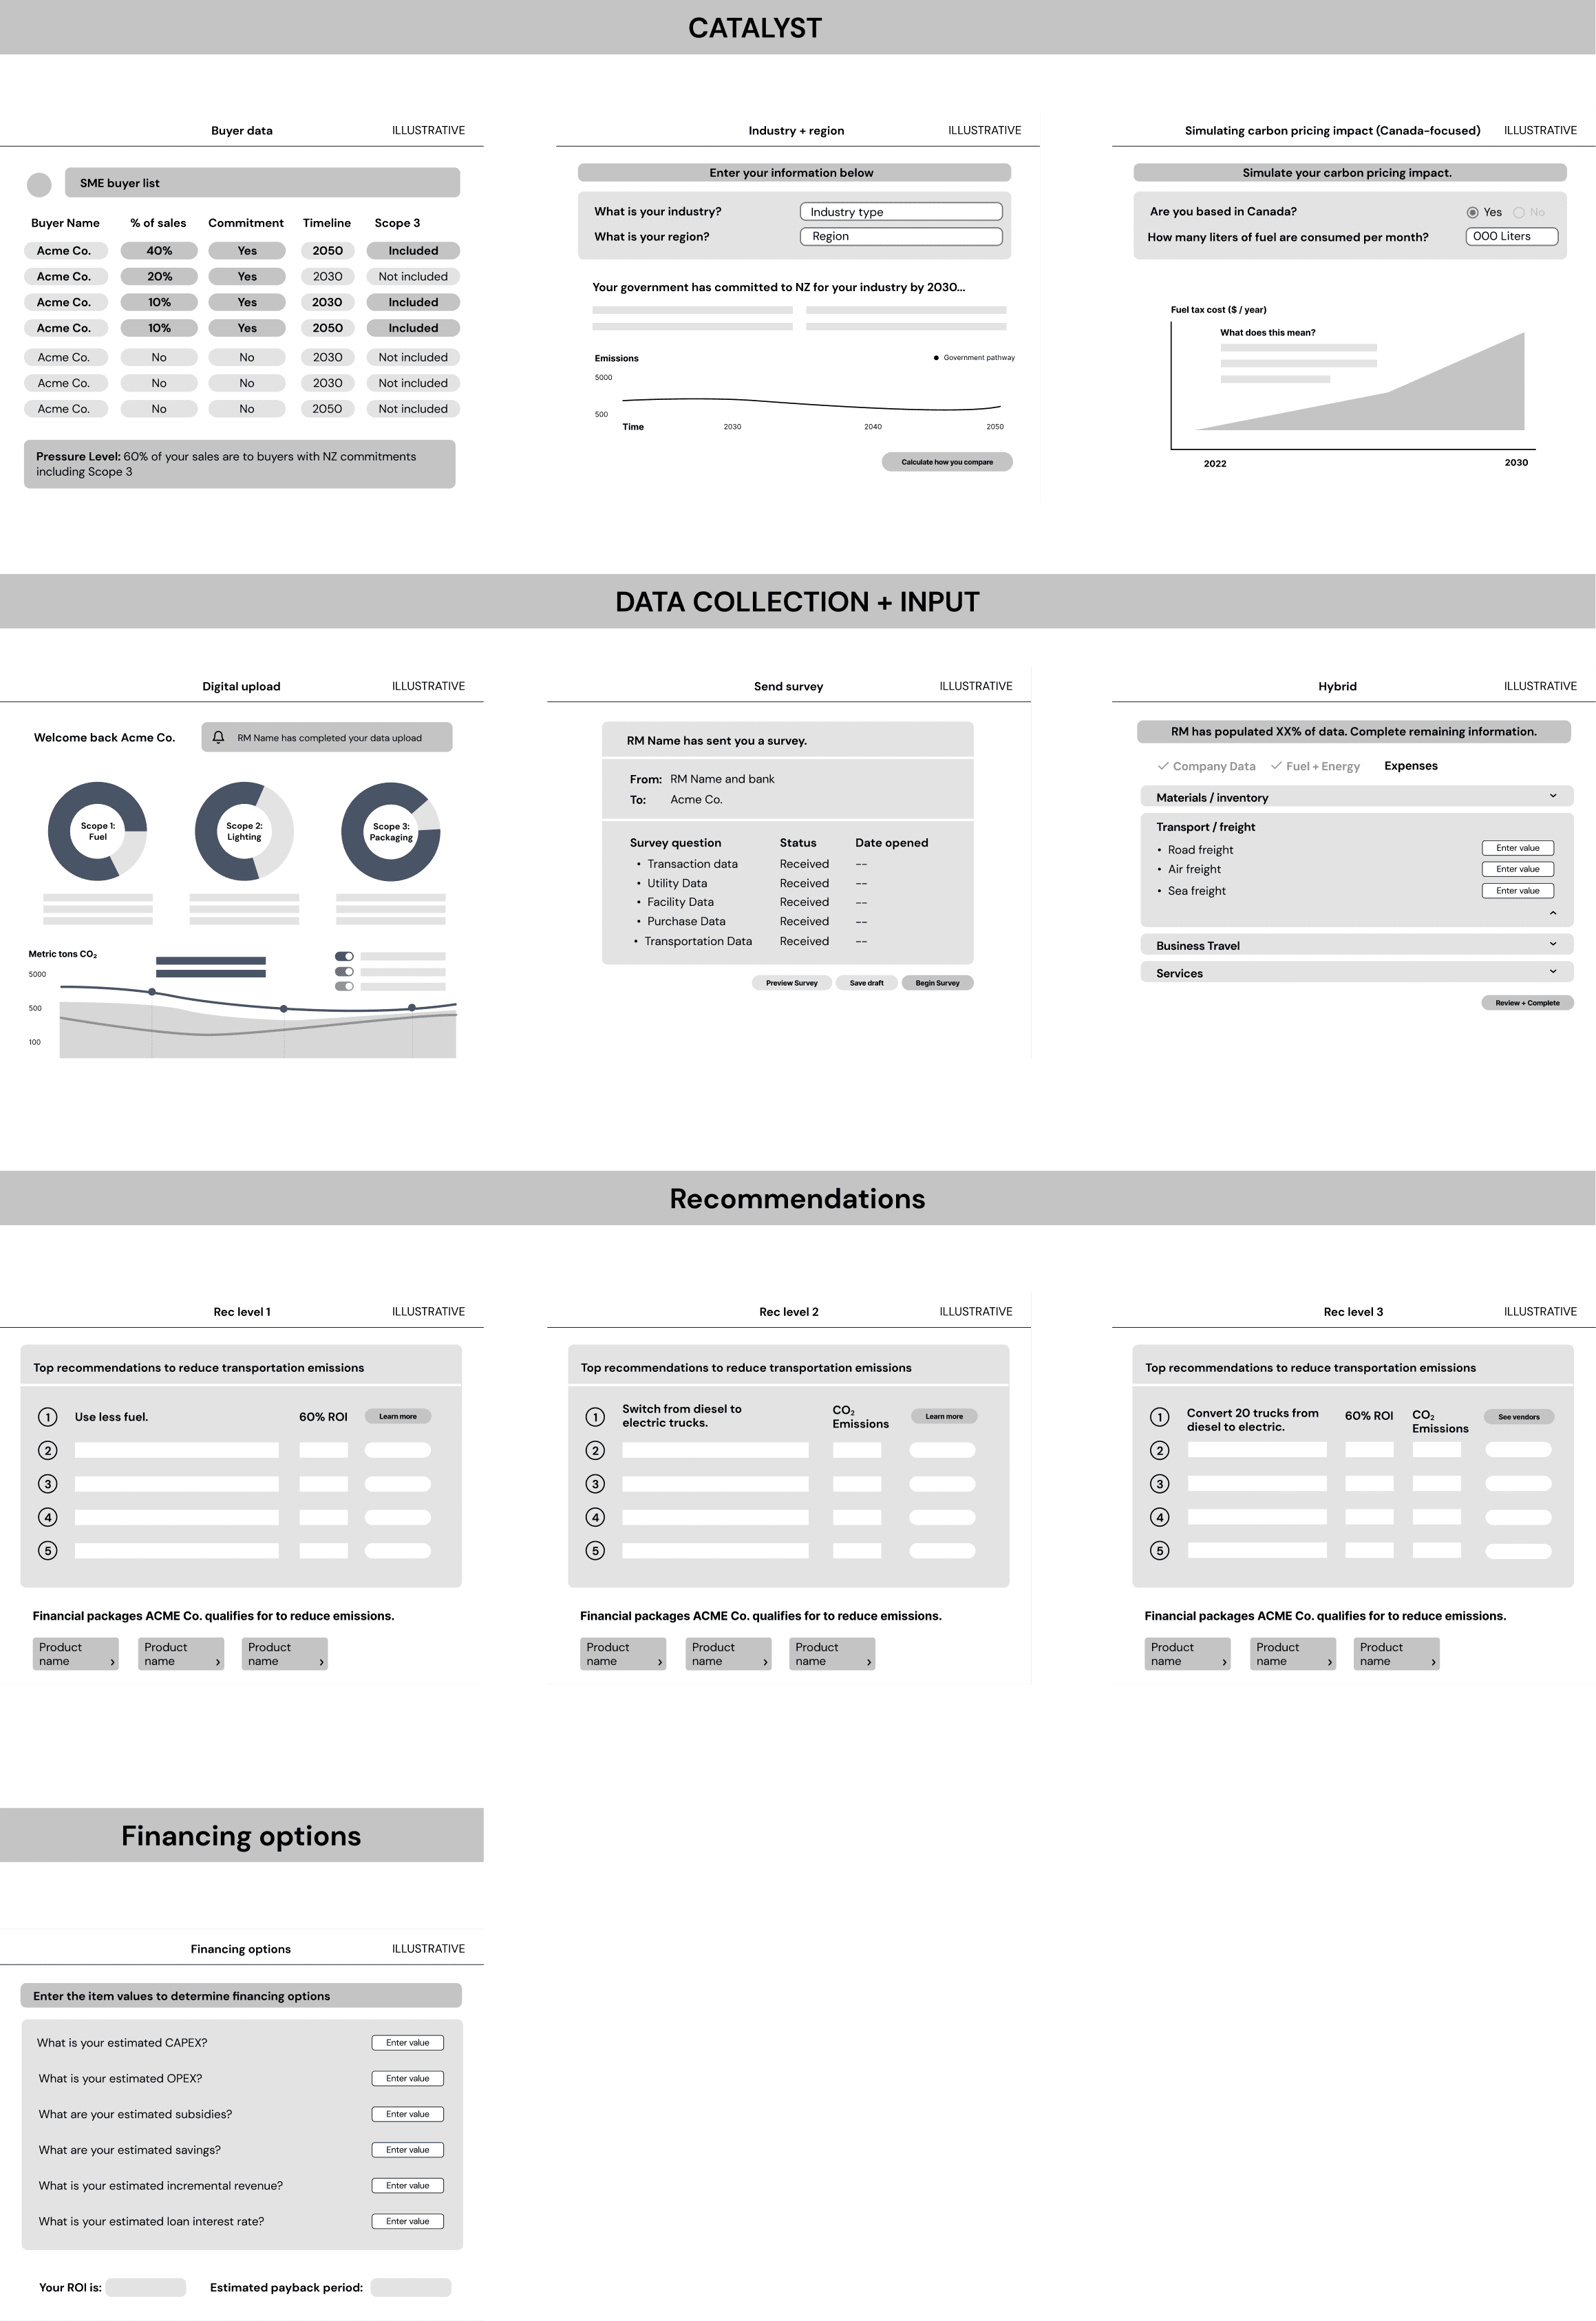
Wireframes
Once we aligned on the screen content and user flows, we moved into the creation of preliminary wireframes.
Design Feedback & Iteration
To ensure our design decisions were intentional and aligned with the product strategy, I created a set of criteria for the team’s design reviews. These criteria helped us evaluate each solution against the product’s core goals: helping users understand climate impact, measure emissions, receive tailored recommendations, compare options, and connect actions to financing. By grounding critiques in shared principles, we were able to move beyond subjective feedback and make clearer decisions about usability, hierarchy, content, and flow. This created a more focused review process and helped the team design with greater consistency, purpose, and accountability.

Title
To define the product structure, the team created separate information architecture diagrams for the two primary user types: Relationship Managers and SME clients. This helped clarify how each audience would move through the platform based on their goals, responsibilities, and level of climate knowledge.